Case Study
E-commerce
Intelligence Dashboard
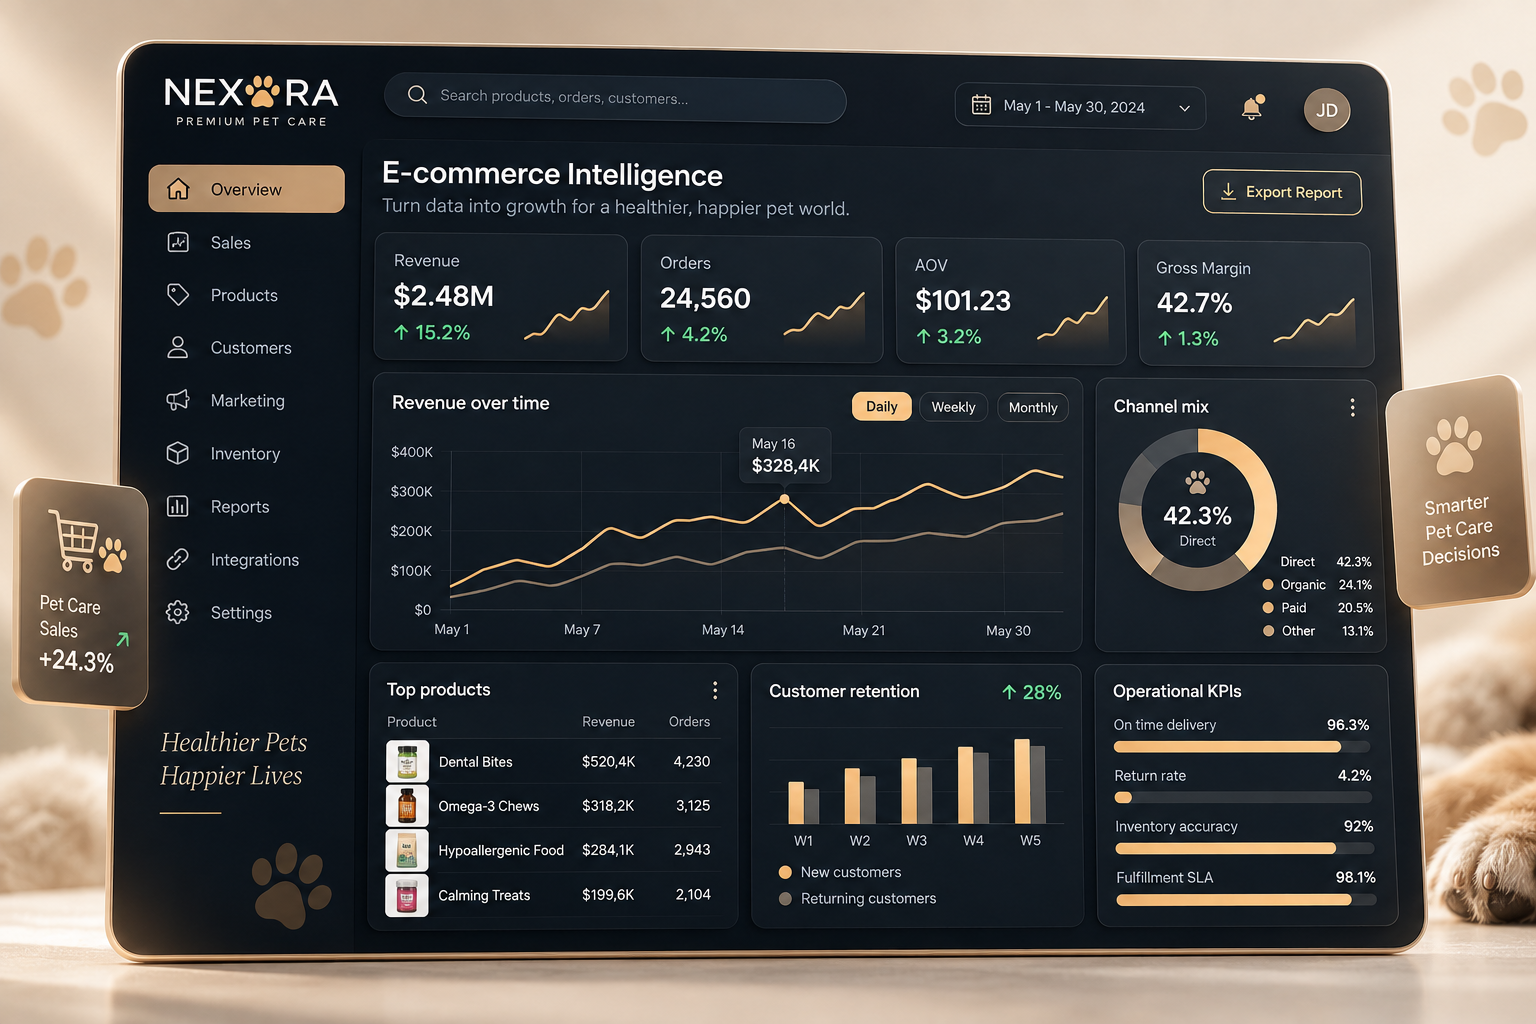
A real-time analytics dashboard connecting sales, customer and operational data to support faster decisions.
The Challenge
- Data was fragmented across sales, marketing, customer support and operations systems.
- Leadership needed a clear view of performance across channels, fulfillment and retention.
- Limited visibility into real-time performance and operational efficiency.
- Teams spent more time preparing reports than acting on them.
The Solution
- Built a centralized analytics dashboard with a single source of truth across key business areas.
- Unified KPIs and definitions to ensure consistency and comparability.
- Near-real-time data pipeline for timely monitoring and alerts.
- Clear, actionable insights tailored to business users.
How It Works
Source Systems
Shopify, GA4, CRM, ERP, support & returns data.
Data Ingestion
Automated pipelines scheduled throughout the day.
Warehousing & Modeling
Cleaned, joined and structured data across business domains.
KPI Dashboard
Looker dashboard with interactive visuals and drill-downs.
Decision Making
Teams monitor trends and act with confidence.
Key Features
Sales Overview
Track revenue, orders and conversion trends at a glance.
Order Trends
Monitor order volume, fulfillment and demand patterns over time.
Customer Insights
Understand retention, LTV, channel behavior and customer segments.
Channel Performance
Analyze performance by campaign, channel and traffic source.
Product Performance
Identify top products, inventory issues and conversion opportunities.
Returns & Operations
Monitor return rates, shipping quality and operational performance.
My Contribution
- Defined success metrics and KPI framework with stakeholders.
- Led discovery, requirements gathering and dashboard scope.
- Designed data model and KPI logic in collaboration with the team.
- Coordinated data integration and dashboard implementation.
- Validated data quality and monitored performance after launch.
- Led user training, documentation and stakeholder rollout.
Business Impact
80%
Faster reporting
Reporting time cut from days to hours.
45%
Reduction in manual work
Less spreadsheet work and easier stakeholder alignment.
30%
Increase in visibility
Better data coverage across teams and functions.
Better
Decision-making
Faster, clearer decisions across sales and operations.
Tech Stack
Let’s build something useful.
If you have an AI, automation or digital product challenge, let’s turn it into a clear and executable solution.
Book a consultation